For some time now (at least a couple of months) I am seeing 100% cpu use whenever I bring up Octopi on a browser. This is on 2 different PC's, and the choice of browser doesn't make any difference - I've tried Firefox, Edge, Chrome, Safari on a Mac.
Any ideas what would cause this or how to go about troubleshooting would be appreciated. If I bring up Octopi it pretty much kills the PC for anything else. I had to kill the Octopi tab just to be able to type this, otherwise it's too painful.
The printer is a MakerGear M3ID with included Raspberry Pi. Octoprint says it's running version 1.3.6.
I notice this whenever I connect my Safari browser, for example, to my OctoPrint instance: one of the cores will go to 100% while it returns pages for a bit. It seems normal to me, the collection of pages, scripts, images, stylesheets from OctoPrint and the array of plugins is a fair bit to transfer to the browser.
In a case like this, I'd use Safari. I'd right-mouse click in the body of the webpage and choose Inspect. I'd then take a look at the Network tab and see which part of that is grinding forever.
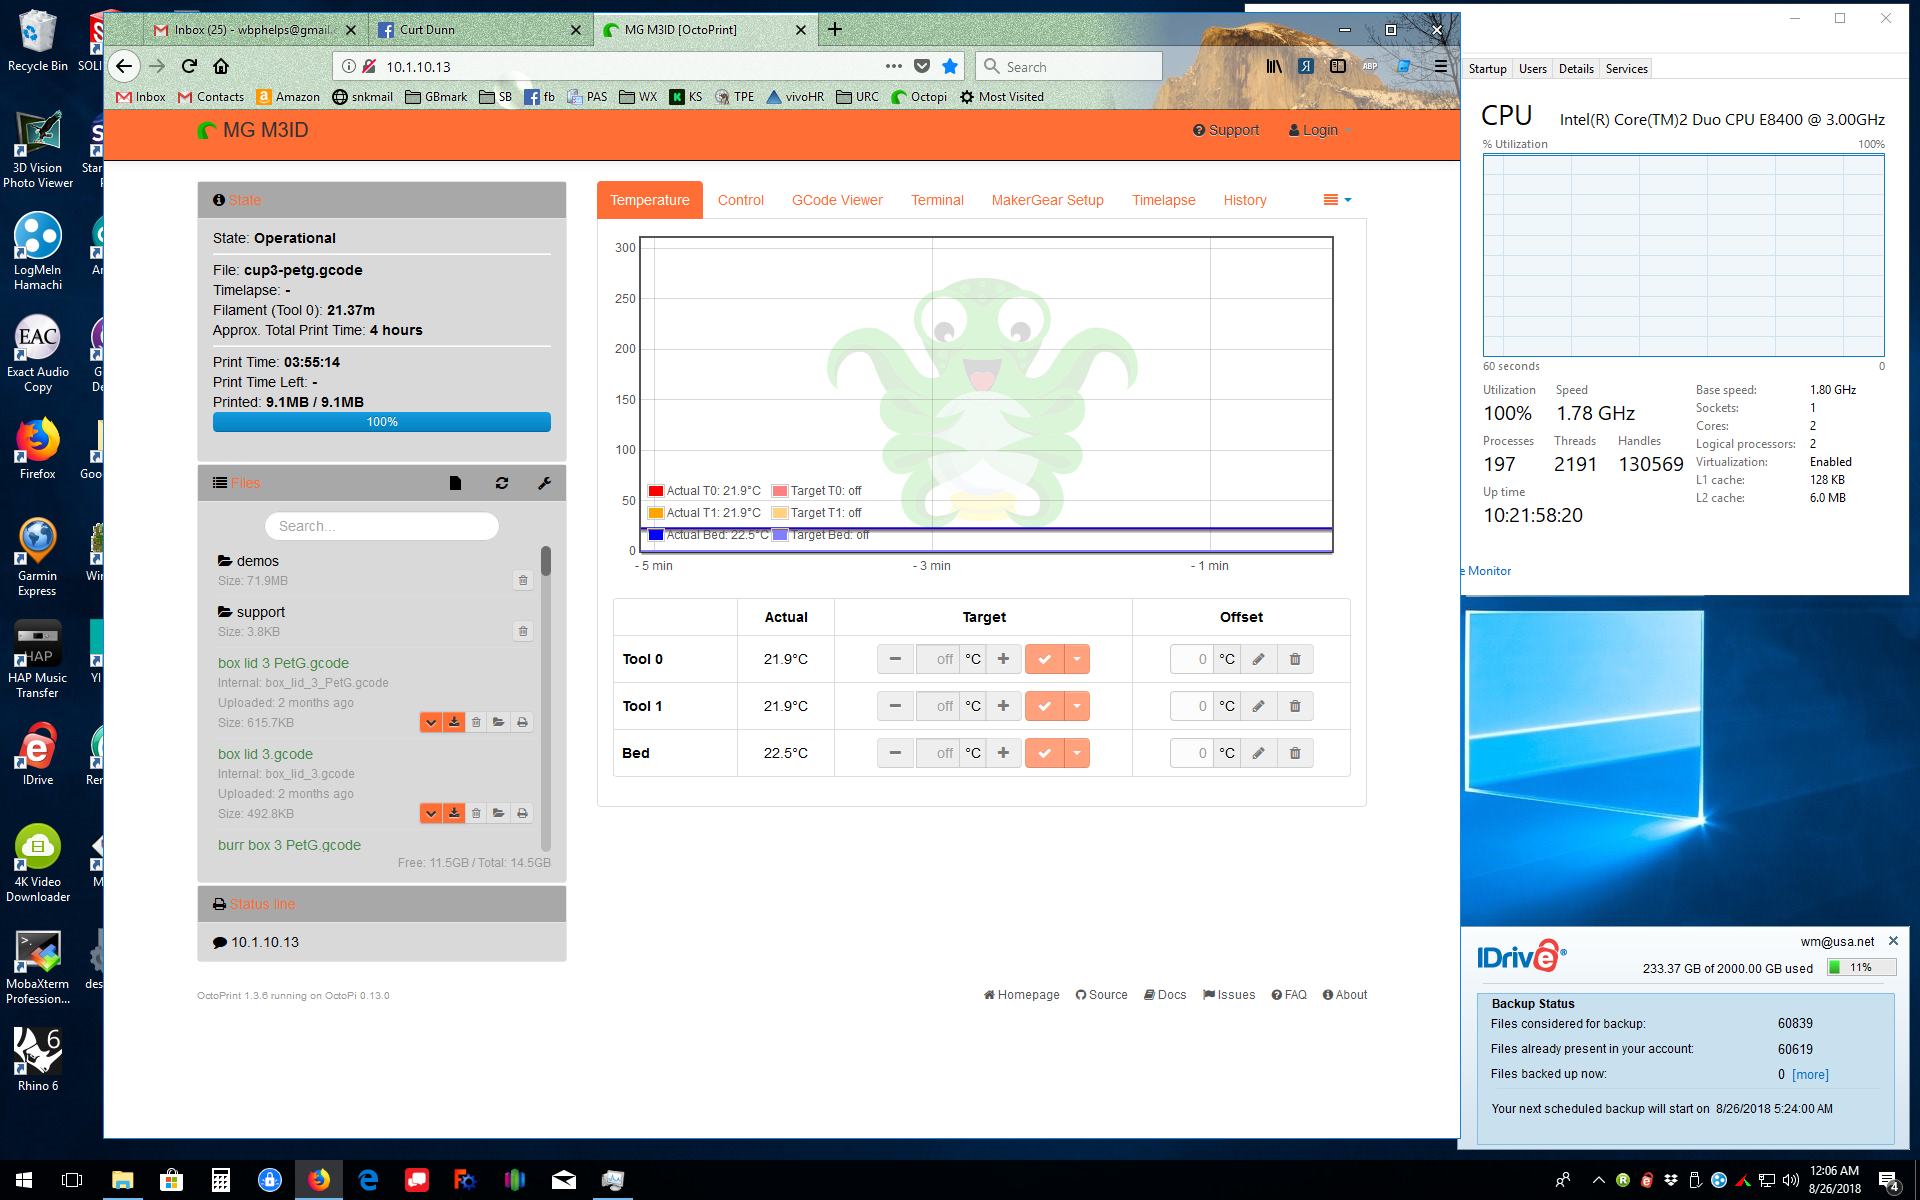
Here's a screen shot. Notice the Task Manager display in the upper right corner - 100% CPU. All I did was point the browser (in this case Firefox) at Octopi and let it load. Sure wish I could figure this one out.
I wonder if OctoPrint either lost its Internet connection or its DNS server. So if it's trying to resolve some server to pull down an update, it would fail and cycle.
That doesn't make sense. The Software Update plugin is bundled and hence also stays enabled in safe mode. If your issues vanished in safe mode, it can't have been the Software Update plugin. It could however have been some other plugin you have installed interacting with the SWU plugin causing this problem.
I'd suggest to re-enable SWU, disable all third party plugins and then start disabling all third party plugins one by one.
I was very careful in my testing, and it took quite a bit of time. I disabled all of the plugins and then re-enabled them one by one. When I enabled the Software Update the CPU utilization went back to 100%. When I disabled Software Update the CPU usage went back to normal. Please see attached screen capture. ALL of the plugins are now enabled EXCEPT Software Update.
I have been a systems programmer over 50 years (since the 60's), including working on everything from large multi-processor operating systems to compilers and interpreters. I am very methodical in my testing.
I'm just saying the current conclusion doesn't make sense as it is inconsistent. You stated that the issue went away when running OctoPrint in safe mode. The Software Update plugin is bundled and hence stays enabled in safe mode. If the issue went away in safe mode with an enabled Software Update it can't be the Software Update plugin on its own or the issue would not have gone away in safe mode. There must be a different/additional factor at play here, possibly another plugin doing something that causes the SWU plugin to consume 100% CPU load (though what, I have no idea at all, the frontend component of the SWU plugin is pretty light weight).